
The effectiveness of an Intrusion Detection System (IDS) relies heavily on the quality and diversity of the datasets used during its training and evaluation However, due to confidentiality concerns, companies keep their data private, which acts as a hindrance to IDS-based research. To bridge this gap, researchers and cybersecurity centers have simulated experiments to generate research datasets. While these datasets have propelled the field of cybersecurity research forward, they do not alwaysreflect the characteristics of real-world data for an IDS. Therefore, it is advisable to understand the strengths and weaknesses of a dataset before utilizing it. MY goal is to conduct a comparative study of the KDD-99, NSL-KDD, UNSW-NB15, CIC-IDS2017, datasets, which are the most widely used in this research domain
KDD Cup 99 #
Origins #
Created in two weeks in 1999 by the Lincoln Laboratory group at MIT, the KDD’99 dataset was built based on data captured during the DARPAIDSevaluation program in 1998. The training dataset consists of approximately 4,900,000 connection vectors, each containing 41 features and labeled as either normal or as an attack falling into exactly one specific attack type. The simulated attacks fall into one of the following four categories:
-
Denial of Service Attack (DoS): An attack in which the attacker makes some computing or memory resource too busy or too full to handle legitimate requests, or denies legitimate users access to a machine.
-
User to Root Attack (U2R): A class of exploit in which the attacker starts out with access to a normal user account on the system (perhaps gained by sniffing passwords, a dictionary attack, or social engineering) and is able to exploit some vulnerability to gain root access to the system
-
Remote to Local Attack (R2L): Occurs when an attacker who has the ability to send packets to a machine over a network—but who does not have an account on that machine—exploits some vulnerability to gain local access as a user of that machine.
-
Probing Attack: An attempt to gather information about a network of computers for the apparent purpose of circumventing its security con trols.
The datasets contain a total of 24 training attack types, with an additional 14 types appearing only in the test data
Features Classifications #
KDD’99 features can be classified into three groups:
-
Basic features: This category encapsulates all the attributes that can be extracted from a TCP/IP connection. Most of these features lead to an implicit delay in detection.
-
Traffic features: This category includes features that are computed with respect to a window interval and is divided into two groups:
- Same host features: Examine only the connections in the past 2 seconds that have the same destination host as the current connection, and calculate statistics related to protocol behavior, service, etc.
- Same service features: Examine only the connections in the past 2 seconds that have the same service as the current connection.
-
Content features:are attributes that look at the actual data inside a network packet (the payload), rather than just looking at the speed or volume of the traffic
Criticisms and Flaws #
As mentioned in the previous section, since KDD’99 is built based on
DARPA’98, it has inherited certain problems already present in that
dataset. McHugh strongly criticized the generation procedure of the
DARPA’98 dataset, focusing his critique on three main points: the lack
of realism and data validation, the unverified risk of packet loss, and the
absence of clear attack definitions.
Later, Mahoney and Chan analyzed the background traffic of the DARPA
dataset and found evidence of simulation artifacts that could lead to an
overestimation of the performance of certain anomaly detection tech
niques. For instance, Time To Live (TTL) values of 126 and 253 appear
only in hostile traffic, whereas in most background traffic, the values are
127 and 254. Similarly, some attacks can be identified by anomalous
source IP addresses or anomalies in the TCP window size field.
Furthermore, the aforementioned simulation artifacts do not affect the
KDD dataset directly, as the 41 features used in KDD are not related to any of the weaknesses mentioned in. However, KDD suffers from addi
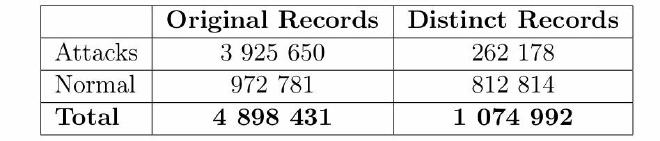
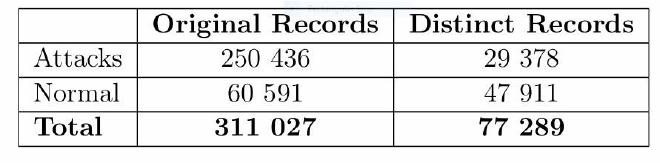
tional problems, such as record redundancy and a skewed distribution of
attacks within the dataset. The statistics regarding redundant records
in the KDD dataset are presented below:
NSL-KDD #
Origins #
In 2009, in an effort to address the issues encountered in the KDD dataset, researchers from the University of New Brunswick (UNB) in Canada created an improved version called NSL-KDD, which focused on three main objectives. The first goal was to remove duplicate records from the training and test sets of the KDDCUP’99 dataset to prevent classifiers from becoming biased toward frequently repeated records. Sec ondly, a diverse selection of records from different parts of the original KDD dataset was chosen to ensure more reliable results from classifier systems. Thirdly, the imbalance in the number of records between the training and testing phases was addressed to decrease False Alarm Rates (FARs).
Criticisms and Flaws #
However, the major disadvantage of NSL-KDD is that it does not repre sent modern low-footprint attack scenarios
UNSW-NB15 #
Origins #
Despite the improvements made to KDD to create the NSL-KDD dataset, two major issues persisted: a lack of attack variety and the fact that the NSL-KDD dataset is not realistic enough. In 2015, authors Nour Moustafa and Jill Slay from the University of New South Wales (UNSW) in Canberra, Australia (Cyber Range Lab), decided to create a dataset named UNSW-NB15. Thisdataset aims to better reflect modern network traffic with a diverse range of attack types.
Features Classifications #
The creation of the dataset was based on the study of an isolated network known as the Cyber Range Lab, with feature extraction performed using Bro-IDS and Argus. The dataset consists of 49 features and comprises 9 different families of attacks. These 49 features can be classified into five distinct categories:
- Flow Features:Flow Features These are the identifiers that distinguish one connection from another. They do not describe the behavior of the attack, but rather identify who is communicating.
- Basic Features:these are the fundamental attributes extracted directly from the packet headers. They describe the state, volume, and duration of the connection.
- Content Features:these features look deeper into the TCP/IP window or the actual payload (data) of the packe;
- Time Features:these features analyze the timing and frequency of the communication.
- Additional Generated Features:These are features that are calculated or derived from the raw data to help Machine Learn ing models learn better.they are mathematical combinations designed to highlight relationships between connections or specific patterns. The dataset is available in two different formats: The original publication format: This includes four files named
- UNSW-NB15_1
- UNSW-NB15_2
- UNSW-NB15_3
- and UNSW-NB15_4 Each contains 700,000 records, except for the last one, which contains 440,044 records. The standard format: This contains two files: UNSW_NB15_training-set.csv: Containing 175,341 records. UNSW_NB15_testing-set.csv: Containing 82,332 records. In general, two additional files accompany these datasets: UNSW-NB15.CSV, which contains the ground truth table for the attacks, and UNSW-NB15_LIST_EVENTS, which contains the attack categories and subcategories
Critism and flaws #
In 2016, Gharib et al. identified 11 essential criteria for constructing a reliable dataset. None of the existing Intrusion Detection System datasets were able to meet all 11 criteria. The 11 criteria of this frame work are: ’Complete Network Configuration, Complete Traffic, Labeled Dataset, Complete Interaction, Complete Capture, Available Protocols, Attack Diversity, Anonymity, Heterogeneity, Feature Set, and Metadata.’ Researchers at the Canadian Institute for Cybersecurity (CIC) demon strated that most datasets are outdated and unreliable for evaluation purposes. Consequently, in 2017, they created a dataset named CI CIDS2017, which satisfies the 11 aforementioned criteria
CIC-IDS2017 #
Origins #
The CICIDS2017 dataset is constructed based on the abstract behav ior of 25 users, utilizing protocols such as email, HTTP, HTTPS, FTP, and SSH. It contains up-to-date attacks and meets all the IDS criteria mentioned previously. The dataset consists of CSV files containing flow records generated via CICFlowMeter, as well as PCAP files of sniffed network traffic. The traffic data was captured over a total period of five days. Attacks were conducted during working days (Tuesday to Friday) in both the morning and afternoon. The implemented attacks include DoS, DDoS, Heartbleed, Web attacks, FTP Brute Force, SSH Brute Force, Infiltration, Botnet, and port scans. Monday serves as the normal baseline and includes only legitimate traffic.
Features Classifications #
The CICIDS2017 dataset is distributed in two compressed files: Gener atedLabelledFlows and MachineLearningCVE. The first file includes 85 features plus one for the attack type label, whereas the second file in cludes 78 features plus the label. The difference between the files amounts to 6 features; these specific features in the first file are used for flow iden tification. Among these 6 features, attributes such as FlowID, Sour ceIP, SourcePort, and DestinationIP in the first file were incorrectly considered as features for model training in some studies. For instance, source IP addresses and ports change continuously on a network. Fur thermore, the FlowID consists of a quadruplet (SourceIP, SourcePort, DestinationIP, DestinationPort) and is considered a redundant feature. Consequently, to avoid the risk of overfitting, it is recommended to use the second file. The machine learning component of the CICIDS2017 dataset (MachineLearningCSV.zip), contains eight CSV files representing the network traffic profile for five days, covering both normal and attack traffic for each day. The structure of the dataset, in terms of records and features, consists of 2,830,743 rows, 78 feature columns, and 1 label column.
Criticisms and Flaws #
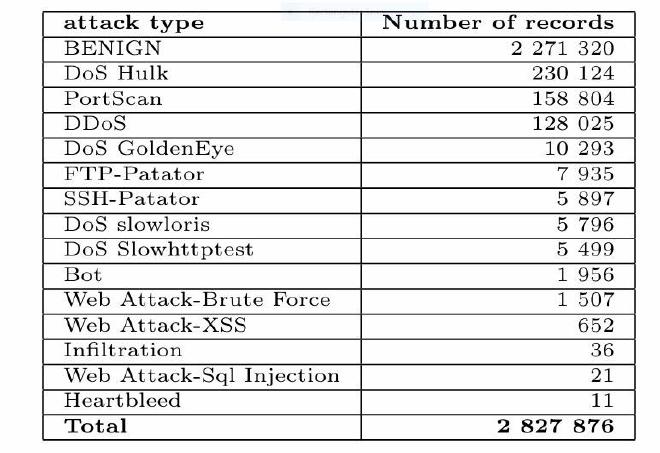
Challenges encountered with the CICIDS2017 dataset include data im balance, as well as the existence of null and infinite values. For exam ple, in the bot.csv file, there are 191,033 records distributed as 189,067 labeled “Benign” and 1,966 labeled “Bot.” Among the 189,067 benign records, there are 112 null values, and for the bot records, there are 10 null values. After removing the null values, the table below displays the different records by attack class. We observe a massive imbalance be tween the classes; by predicting only the “Benign” class, an AI model achieves 80% accuracy, and by correctly predicting only the top four classes, it reaches an accuracy of 98%